The data for the plot was generated by Michael Rubinstein, based on the coefficients and eigenvalues for the first GL(3) Maass form discovered by Ce Bian and Andrew Booker.
Below we summarize some facts about L-functions and then explain the above graph and what you can learn by looking at it.
| Λ(s) | = | Qs ∏j Γ(λj s +μj) L(s) |
| = | ε &Lambda*(1-s) . |
Key to the symbols:
| L(s) | The L-function |
| s=&sigma+i t | a complex number |
| an | The Dirichlet series coefficients of the L-function, normalized so that a1=1. The (very deep!) Ramanujan conjecture asserts that an = O(n&epsilon). This implies (but is stronger than) the Dirichlet series converges for σ>1. |
| Γ | The Gamma function |
| λj | Positive real numbers. It is conjectured that one can take λj = ½ for all j . The number 2 ∑ &lambdaj is called the degree of the L-function, which is conjectured to be an integer. |
| μj | Numbers with non-negative real parts. |
| Q | A positive number. |
| ε | A number with absolute value 1, called the sign of the functional equation. |
| * | Complex conjugate, operating on functions by f*(z) := f(z*)*, where the * on the right side is conjugation in the usual sense. |
The functional equation can also be written in an asymmetric form
L(s) = ε X(s) L*(1-s),
where X(s) can be obtained by rearranging the functional
equation written above.
Finally, we have the Z-function associated to L,
defined by
Z(t) = (ε X(½ + i t))-½ L(½+i t) .
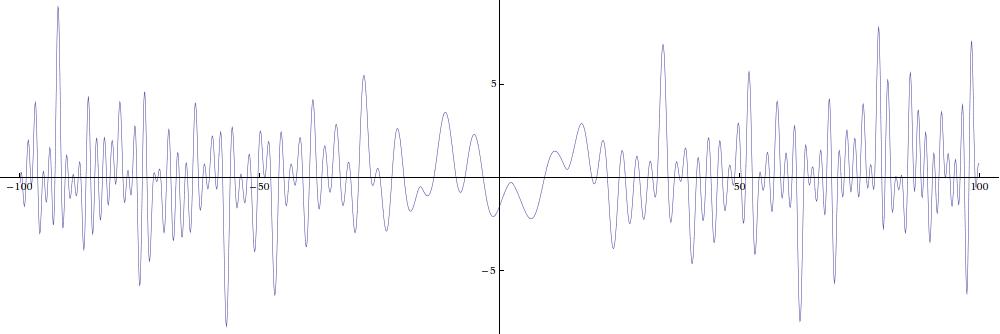
Now the functional equation says Z(t) is real if t is real. It also follows that Z(t) and L(½+i t) have the same absolute value if t is real. Since Z(t) is a real valued function of a real variable, its graph is easy to visualize. The plot shown above is the Z-function associated the the first Maass form found by Bian and Booker for GL(3,Z).
In Mathematica the Z-function of the Riemann zeta function (sometimes called the "Hardy Z-function"), is called RiemannSiegelZ[t].
The Z-function is prettier to graph than L or Λ, but it is not as nice of a function because it has branch points arising from the zeros and poles of X(½ + i t). The Riemann Hypothesis for Z is the assertion that the only zeros of Z(t) with Im(t)<½ are on the real axis.
There appear to be three places near the middle of the graph above where
the Riemann Hypothesis is violated, but this is just an effect of the
trivial zeros. Since the Gamma factors are of the form
π-3 s/2 Γ(s/2 + r1)
Γ(s/2 + r2)
Γ(s/2 + r3)
where r1 ≈ -1.19,
r2 ≈ -7.07,
and r3 = - r1 - r2 ≈ 8.26 ,
there are trivial zeros whose real part is a negative even integer,
and whose imaginary part is -2 rj. Those trivial
zeros, which are not violations of the Riemann Hypothesis, are what
cause the graph to turn around without crossing the axis.
Any other place with a positive local minimum or a negative local maximum would indicate a violation of the Riemann Hypothesis! The plot may appear to show such a problem near t=-49 and near t=93, but a numerical calculation (courtesy of Michael Rubinstein) finds that Z(-48.9)=-0.0294467 and Z(92.9)=-0.0175431.